Power BI Training in Mumbai
Are you looking to take your data analytics skills to the next level 'OR' looking for data visualization skill enhancements that will help you to grow in your professional career? Are you someone who uses MS Excel and many other tools on a daily basis but is not getting the precise visualization results that you want to achieve? Are looking for Power BI Training Institute in Mumbai. Then to fulfil your all the need related to data analytics and visualisation Advanced Excel Institute (By Pankaj Kumar Gupta) has introduced an Advanced Data Visualization program using Power BI and Power Query that includes all the Data Visualization concepts Using Power BI, Data ETL concepts Using Power Query and Data Analysis Concepts Using DAX In power BI. Advanced Excel Institute is serving you from over a decade now in the field of Data Analysis, Data visualization, Data Manipulation and Data Streaming.
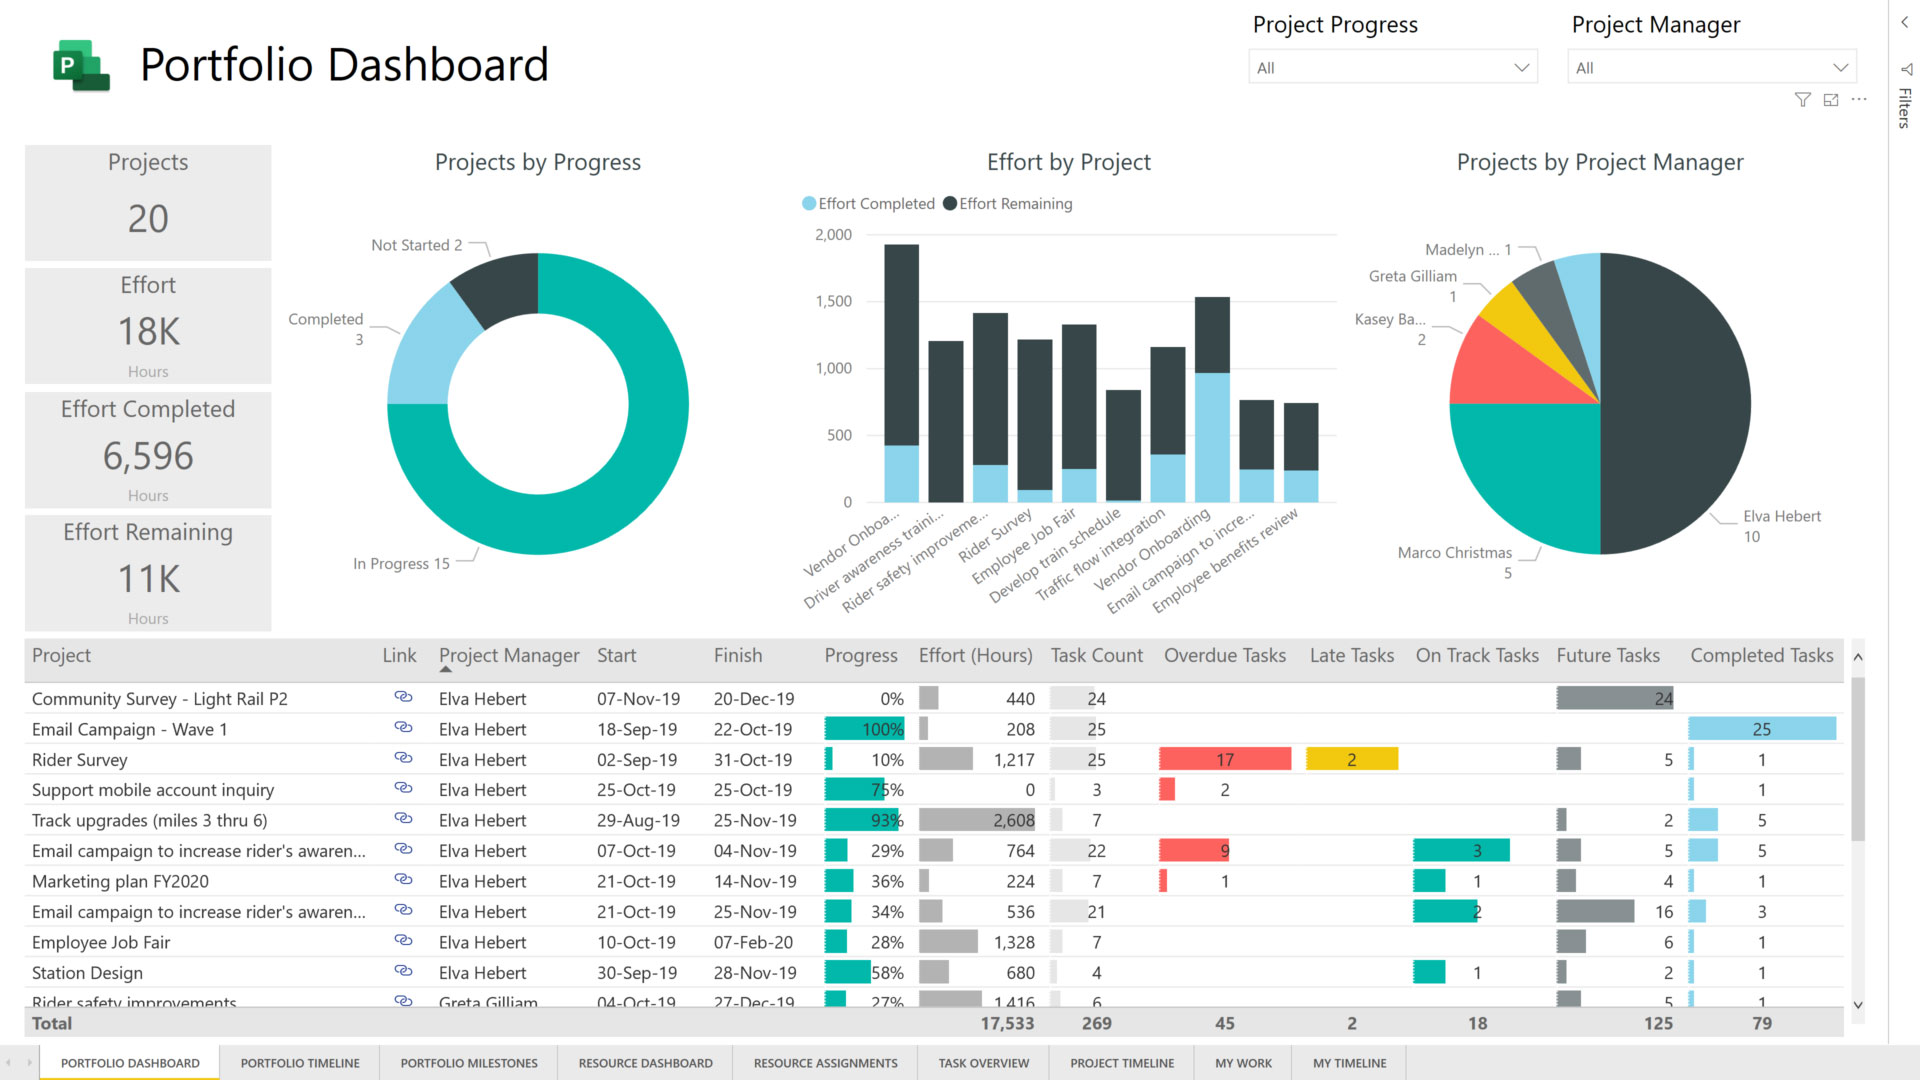
Advanced Excel Institute, Power BI Coaching in Gurugram has designed the program in that way that helps cater to the needs of both individuals and businesses. Whether you are a beginner or an experienced user, there are training programs available that can help you learn and improve your skills.
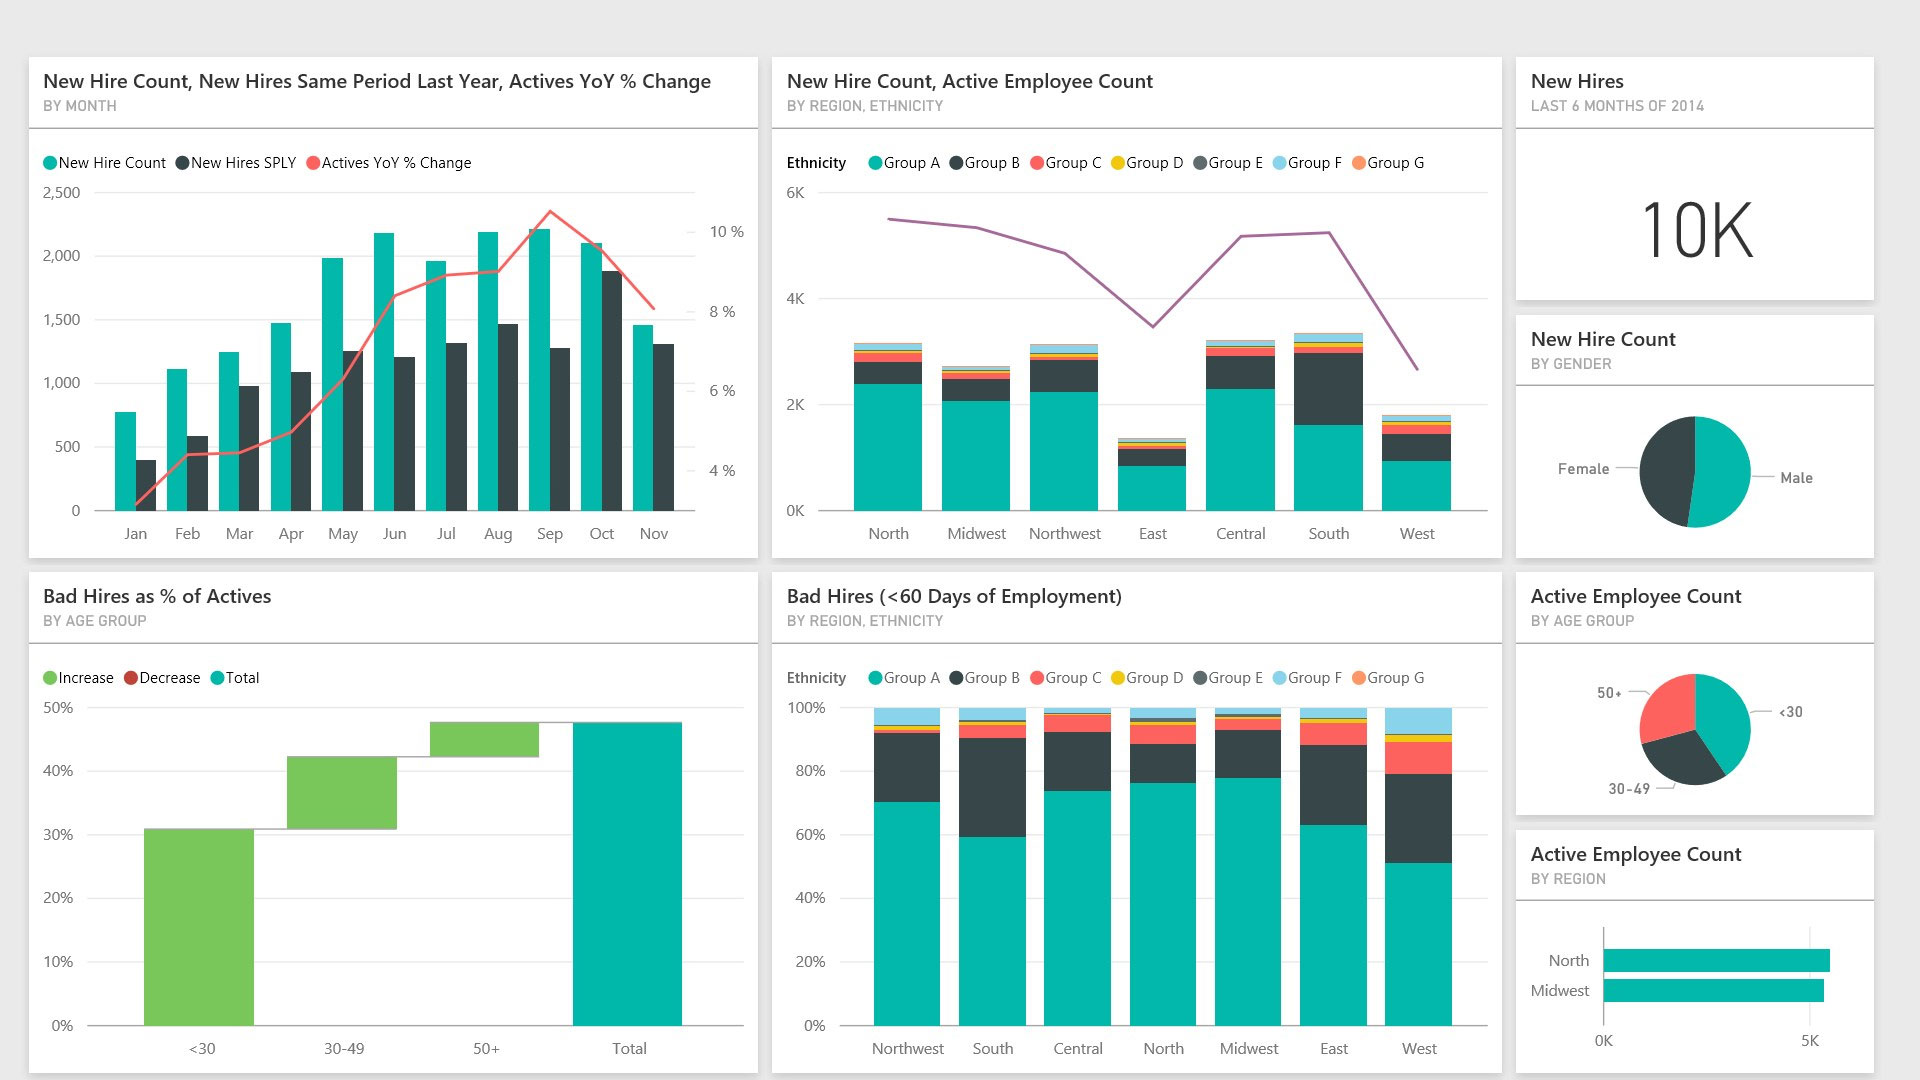
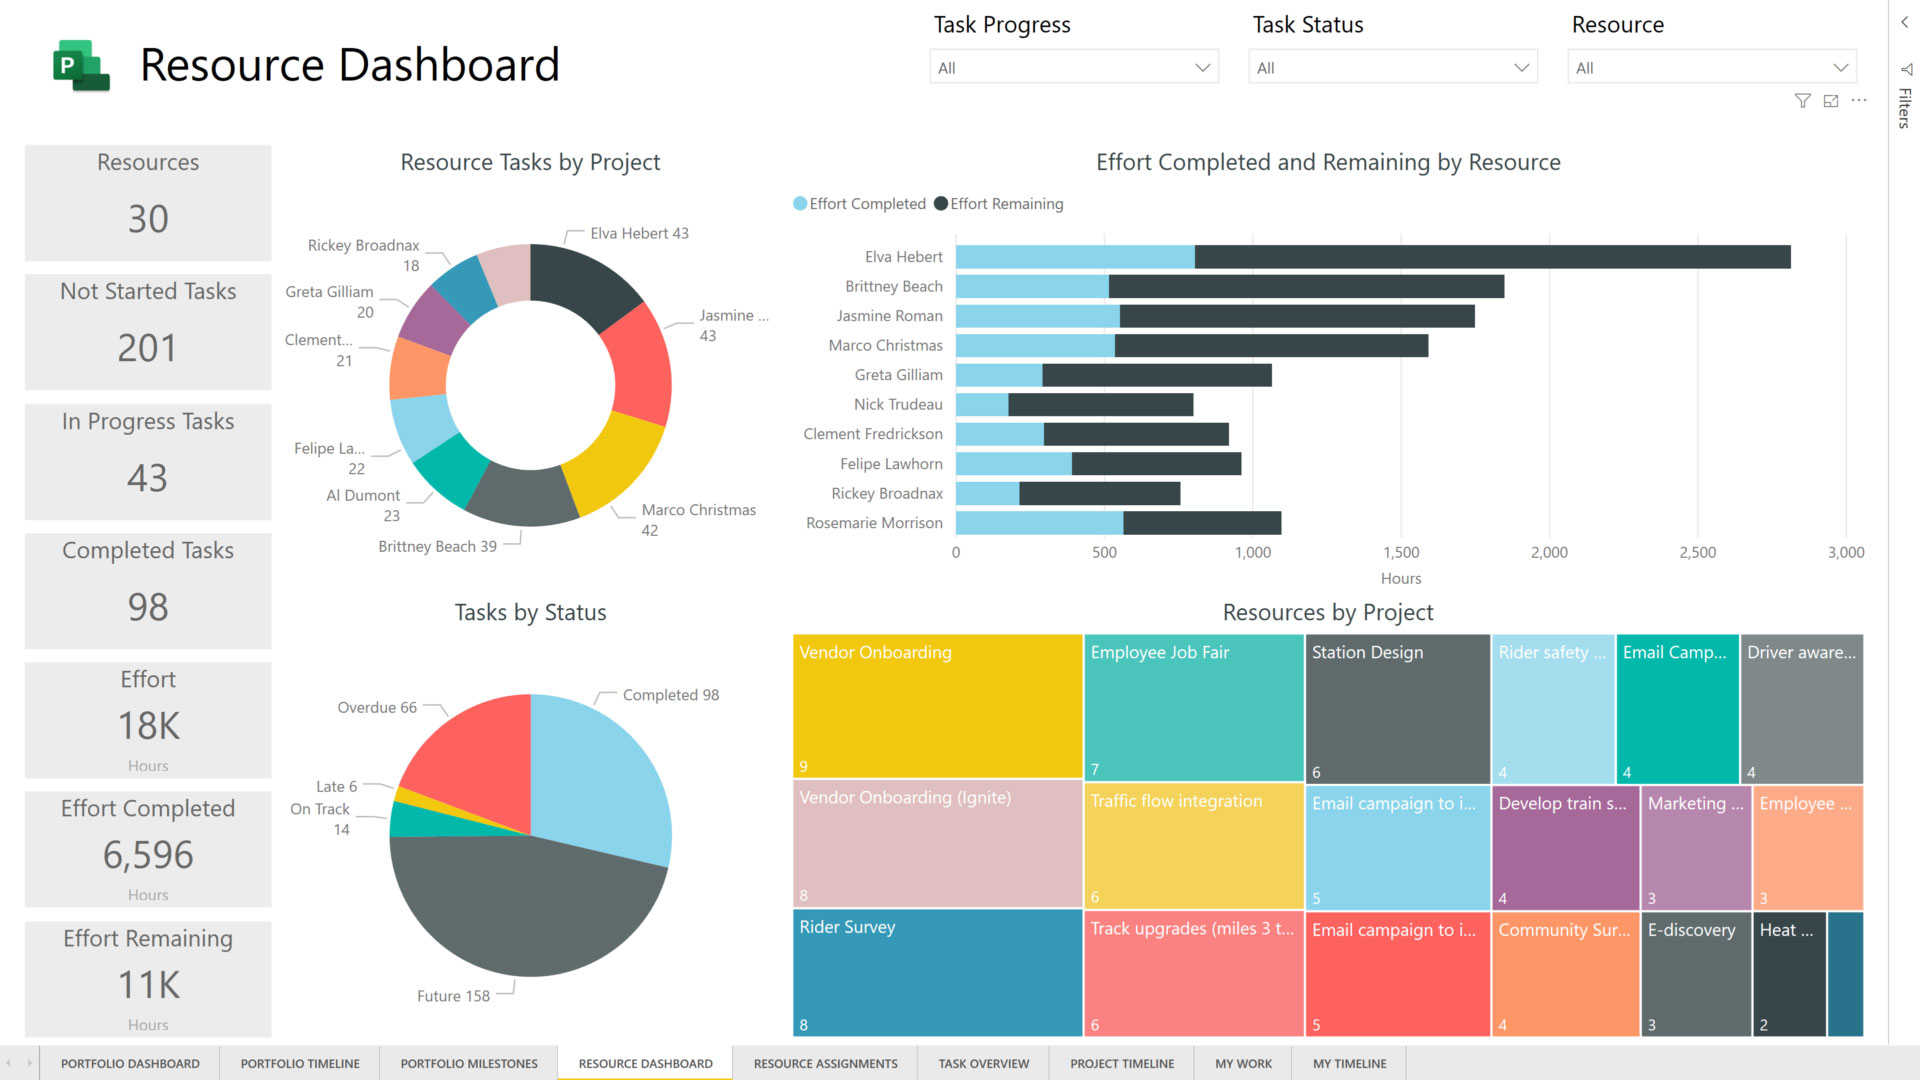
Advanced Excel Institute, Power BI training centre in Gurugram covers a wide range of topics, including data modelling, data transformation, report design, and dashboard creation. Participants learn how to connect to various data sources, transform data using Power Query, create visualizations, and publish reports to the Power BI service.
Our Amazing Facts and Figures
It took 15 years and lot's of hard work to reach on these amazing numbers. Following are the few numbers which shows our experience and devotion to trainings in industry.
50000
+Working Professionals Trained
800
+Corporate Batches Done
250
+Corporate Clients Covered
Power BI Certification
Power BI Data Analyst
Exam Code: DA-100Power BI Data Analyst Associate
Exam Code: pl-300Power BI Data Analysis Expert
Exam Code: AXL-PB-0721Power BI Data Visualization Expert
Exam Code: AXL-PB-2116Delivery Methods
It is very important to take the practical approach during the training and that is how we deliver the training.
First we identify the prior knowledge of participants and start taking them into the process with hands on experience on each functionality during the training only.
Data and scenarios which are used during the training are real time data which are collected from various industries.
Approx. 25+ case studies will be covered during the training which enhances the skills of participants and makes them capable to start working in corporate culture from day one.

Pankaj Kumar Gupta (Microsoft Certified Trainer)
Founder: Advanced Excel Institute
Trainer’s Profile
The training is conducted by certified trainer who has real-world experience using Power BI in various industries. Mr. Pankaj Kumar Gupta (Microsoft Certified Trainer) who has 14+ years of experience in this field and trained 50000+ working professionals, Already done 700+ corporate trainings. Trainer has already delivered Power BI Corporate Sessions in all over India, Especially Power BI Training In Mumbai, Power BI Training In Delhi, Power BI Training In Mumbai, Power BI Training In Pune, Power BI Training In Bangalore, Trainer provide hands-on training, allowing participants to practice what they have learned and ask questions as they go along. This approach ensures that participants are able to apply what they have learned in real-world scenarios.
Conducted Corporate Sessions In Companies
Ernst & Young (EY),WNS, Sapient, CANARA HSBC, Capgemini India, Cvent India, Lufthansa Airlines India, AirIndia Sats, Kohler India, RSSB(Rwanda Social Security Board, Central Africa ), Bank Of America, Bharti Airtel India, Tower Vision India, Colgate Palmolive, Louis Vuitton India, Genpact, Whirlpool India Ltd. , Airbus India, Pernod Ricard India, Ranstad India, Azure Power, Tilda Hain India, Maruti Suzuki India, Hero Motocorps India, ACME Cleantech Solu-tions Pvt. Ltd.
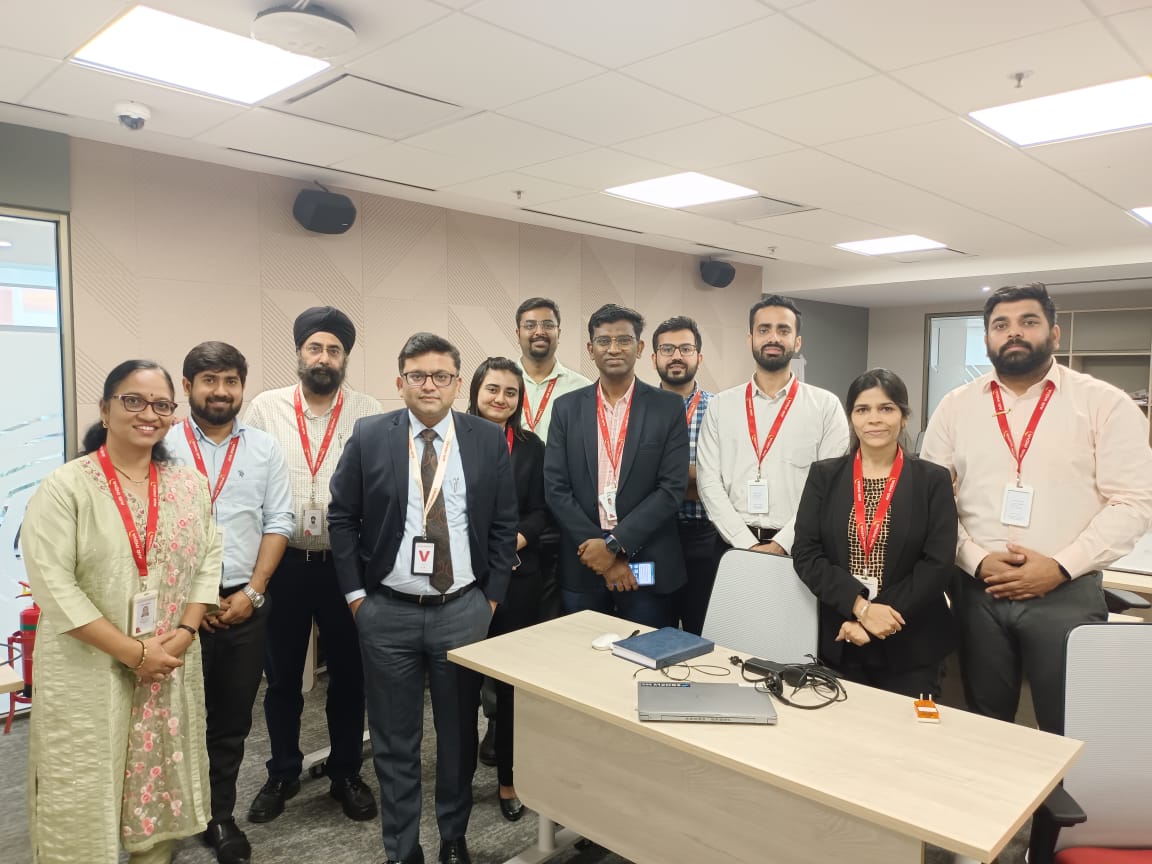
Read MoreCorporate Picture Gallery
Why Choose Us
Advanced Excel Institute offers Power BI Training on both the mode classroom “OR” Online environment, which enable participants to interact with other learners and exchange ideas on the both the platforms. This collaborative environment can help learners gain insights from others and learn from their experiences. We do Power BI Training for corporates and Power BI Training for Individuals both.

Best Industry Based Training

100% Practical Approach Training

Get Trained From highly Experienced And Best Trainer In Industry

Get Certification And Life Time Membership To Institute
Corporates Worked With
1500+ Corporate Batches Done In More Than 400+ Corporates
Join NowFrequently Asked Questions
What is Power BI Desktop?

Power BI Desktop is a Windows application that allows users to create interactive data visualizations and reports. It is a part of the Power BI suite of business analytics tools by Microsoft. Power BI Desktop allows users to connect to various data sources, including Excel spreadsheets, cloud-based services such as Azure SQL Database and Salesforce, and on-premises data sources such as SQL Server and Oracle databases.
Where do I get started with Power BI?

- Sign up for Power BI: If you don't have a Power BI account, you can sign up for a free account on the Power BI website.
- Download and Install Power BI Desktop: Power BI Desktop is a Windows application that allows you to create reports and visualizations. You can download it for free from the Power BI website.
- Connect to your data: Once you have installed Power BI Desktop, you can connect to your data sources. Power BI Desktop supports a wide range of data sources, including Excel spreadsheets, cloud-based data sources such as Azure SQL Database and Salesforce, and on-premises data sources such as SQL Server and Oracle databases.
- Create your report: After you have connected to your data, you can start creating visualizations and reports in Power BI Desktop.
- Publish your report to Power BI service: Once you have created your report in Power BI Desktop, you can publish it to the Power BI service, which is a cloud-based platform for sharing and collaborating on reports.
- Share your report: You can share your report with others by giving them access to your Power BI workspace or sharing a link to the report.
- Explore and analyze your data: Once your report is published to the Power BI service, you can explore and analyze your data using different tools and features.
Why should we use Power BI?

- Interactive data visualization
- Easy to use
- Integrates with various data sources
- Collaboration
Does Power BI support mobile devices?

Yes, Power BI has mobile apps for iOS, Android, and Windows devices. The mobile app allows you to access your Power BI reports and dashboards from anywhere, and stay connected to your data on-the-go. The Power BI mobile app provides a responsive and optimized view of your reports and dashboards on a mobile device, so you can view and interact with your data in a way that is convenient and efficient
How is Power BI different from other BI tools?

- Integration
- User-Friendly
- Cloud-based
- Cost-effective
- Powerful Analytics
- Customizable
Name the different connectivity modes available in Power BI?

- Import
- Direct Query
- Live Connection
- Power BI Dataflows
- Power BI datasets
Explain how relationships are defined in Power BI Desktop?

To define a relationship in Power BI Desktop, follow these steps:
- Open Power BI Desktop and select the "Modeling" tab from the ribbon at the top of the screen.
- Select "Manage Relationships" to open the Manage Relationships dialog box.
- In the dialog box, select the first table that you want to link to another table. This will be the table on the "one" side of the relationship.
- Select the field in the first table that corresponds to the field in the second table that you want to link to. This is known as the "foreign key."
- Select the second table that you want to link to. This will be the table on the "many" side of the relationship.
- Select the field in the second table that corresponds to the field in the first table that you selected earlier. This is known as the "primary key."
- Select the type of relationship that you want to create, such as "one to many" or "many to many."
- Click "OK" to save the relationship.
What are the different views available in Power BI Desktop?

- Report view
- Data view
- Relationship view
- Model view
- Home view
- Transform data view
What are the various versions of Power BI?

- Power BI Free.
- Power BI Pro
- Power BI Premium
- Power BI Embedded
- Power BI Mobile
Can I use Power BI with non-Microsoft data sources?

Yes, Power BI supports a wide range of data sources, including Excel, CSV, JSON, XML, and various databases such as SQL Server, Oracle, and MySQL.
How is Power BI different from Excel?

Excel is primarily a spreadsheet application, while Power BI is a business analytics tool. Power BI provides more advanced data modeling, visualization, and reporting capabilities than Excel, and allows users to connect to a wider range of data sources.
Is there a free version of Power BI?

Yes, Power BI offers a free version with limited functionality and data storage. However, more advanced features and larger data storage capacities are available with paid versions such as Power BI Pro and Power BI Premium.
What Our Clients Say About Us
I joined this course with very little knowledge of Ms excel(basic functions and Vlookup), but after the course i am able to write and understand all the complex functions and formulas. The way Sir Pankaj has taught about the different functions and formula writing is really commendable. Be it VBA or excel formula writing skills, Pankaj Sir can turn any excel beginner into an expert. Deserves more than 5 stars
I attended many institute’s demo classes in Gurgaon later I joined AE, after completion of the course I recommend this to everyone. Pankaj has great knowledge and experience. He covers step by step approach to teach which is very good and effective.
I studied from here last month and to be fair, I had a really good experience. The tutor explains all the concepts from the basics and takes it on the next level. It is a 2 month course and the curriculum is well balanced wrt time and difficulty levels.
Best training institute in Gurgaon and NCR. Highly impressed by the trainer, he is such an expert , has deep knowledge of his area. I gained complete knowledge of advanced excel under his guidance. Thank you Pankaj sir.
I like the way, Pankaj teaches here with pictorial and day to day life examples. It’s been over a year I completed my program, whenever I stuck, training notes still help me to understand logic behind the formula that varies with the situations.

 Power BI
