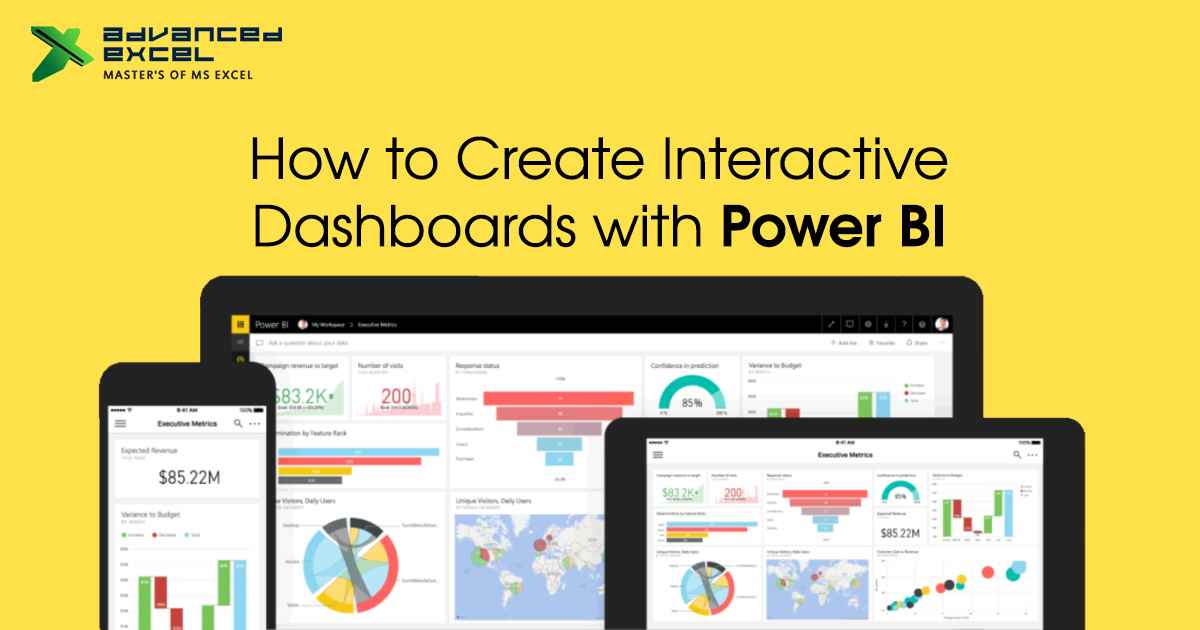
Interactive dashboards are a great way to visually analyze data and gain insights from it. With Power BI training in Gurgaon, you can easily create interactive dashboards that allow you to explore your data in real time. Here are some tips for creating effective interactive dashboards with Power BI. It offers a wide range of visualizations, such as tables, charts, maps, and gauges. Choose the right visuals that best represent your data and provide insights at a glance. Your data source contains multiple tables; create relationships between them to enable drill-downs and other interactive features. This will allow you to explore your data in more detail and gain deeper insights.
What is Power BI?
- Users can connect to a variety of data sources, produce interactive visualizations and reports, and share them with others using the business analytics service Power BI from Microsoft.
- It is a cloud-based service that can be accessed through a web browser or mobile app, and it also has a desktop application for creating and editing reports.
- Power BI offers a wide range of tools for data analysis and visualization, including data modelling, interactive dashboards, and advanced analytics features such as machine learning and natural language processing.
- It can connect to a variety of data sources, such as Excel spreadsheets, databases, and cloud-based services, and it offers a robust set of data transformation and cleaning tools to help users prepare their data for analysis.
- One of the key features of Power BI is its ability to create interactive visualizations and reports that allow users to explore their data in real time.
Interactive Dashboards with Power BI
- Choose the right visuals: Power BI offers a wide range of visualizations, such as tables, charts, maps, and gauges. Choose the right visuals that best represent your data and provide insights at a glance.
- Use filters and slicers: filters and slicers allow you to interact with your data and see different perspectives on it. Use them to narrow down your data based on specific criteria or to drill down into more detailed information.
- Create relationships between tables: If your data source contains multiple tables, create relationships between them to enable drill-downs and other interactive features.
- Add calculated columns and measures: Calculated columns and measures allow you to perform calculations on your data and display them in your visuals. This can help you analyze trends, identify patterns, and make predictions.
- Publish and share your dashboard: Once you have created your dashboard, publish it to the Power BI service so that you can share it with others. You can also embed it in a website or application and set up alerts to notify you when certain data changes.
Introduction to dashboards for Power BI designers
- Dashboards in Power BI are interactive visualizations that provide a high-level overview of your data. They allow you to monitor key performance indicators (KPIs) and track progress toward your goals. With Power BI, you can create customized dashboards that display the data that is most important to you.
- It can be created using various visualizations such as tables, charts, maps, and gauges. These visualizations can be customized to display the data in a way that is easy to understand and provides insights at a glance. You can also use filters and slicers to interact with the data and explore different perspectives.
- It can be connected to a variety of data sources, such as Excel spreadsheets, databases, and cloud-based services. You can also create relationships between tables to enable drill-downs and other interactive features.
- In addition, Power BI dashboards can be shared with others through the Power BI service or embedded in a website or application. This allows you to collaborate with others and share your insights with stakeholders.
Advantages of a Power BI Dashboard
There are numerous advantages to using a Power BI dashboard, including the many advantages of taking courses in Power BI coaching in Gurgaon.
- Interactive Visualizations: It offers a wide range of interactive visualizations, such as charts, tables, and maps, that enable users to explore their data in real time and gain insights quickly. Users can customize the visuals to display the data that is most important to them and use filters and slicers to interact with the data.
- Real-Time Data: They can connect to a wide range of data sources, such as databases, Excel spreadsheets, and cloud-based services, and they offer real-time data analysis capabilities. This means that users can monitor their data in real time and make informed business decisions based on the latest information.
- Collaboration and Sharing: It can be shared with others via the Power BI service, web links, or embedded in a website or application. This allows users to collaborate with others and share their insights with stakeholders.
- Customizable: Dashboards can be customized to display the data that is most important to users. Users can choose from a wide range of visualization options, customize colors and styles, and create custom calculations and measures to analyze their data.
- Data Transformation and Cleaning: It offers a robust set of data transformation and cleaning tools that enable users to prepare their data for analysis. These tools can help users clean and transform data, merge data from different sources, and create relationships between tables.
Components in Power BI
- Power BI Desktop
- Power BI Service
- Power BI Mobile App
- Power BI Gateway
- Power BI Report Server
- Power BI Visuals Marketplace
Culmination
It is a powerful platform for creating interactive dashboards, and there is the best Power BI course in Gurgaon that enables users to gain insights from their data. With its range of visualization options, real-time data analysis capabilities, and collaboration and sharing features, Power BI can help organizations make informed business decisions based on the latest information. By following the steps outlined in this guide, users can create interactive dashboards in Power BI that display the data that is most important to them and provide a dynamic way to explore and analyze their data. With its ease of use and flexibility, it is a valuable tool for businesses of all sizes that want to unlock the full potential of their data.


